Defects are costly for manufacturers. According to the American Society for Quality (ASQ), the cost of poor quality (COPQ) accounts for at least 10-15% of operational expenses.
It makes sense: from processing returns and resolving production line issues to identifying the root causes of quality concerns, reducing the risk of defects is a complex challenge. While the goal of any company is zero defect manufacturing, the sheer number of processes required to create products makes managing defects a top priority.
To help drive down defects, tracking defect density is essential. This key performance indicator (KPI) measures the number of defects relative to the size or volume of outputs. In other words, it provides concrete data about how many products or components are defective and provides a starting point for improved quality control and continuous improvement strategies.
In this piece, we’ll break down the basics of defect density, explore common frameworks and formulas and provide practical advice for application.
Defining defect density
Defect density is represented as a percentage. It is calculated by dividing the total number of defects by the size of production output. For defect density measurements to be effective, manufacturers must clearly define both variables.
Defects
Defects typically fall into three categories: critical, major and minor.
Critical defects render products unusable. Major defects lead to significantly shortened product lifespans, and minor defects impact performance over time.
Consider a company that produces high-tensile steel springs. If springs fail before production is complete or during testing, this is a critical defect. If they complete process manufacturing but fail after fewer than 1,000 compressions by users, this is a major defect. If they do not fail but occasionally display inconsistent compression, this is a minor defect.
To make the most of defect density, evaluate product quality and identify critical, major and minor defects. Next, measure the total number of defects in a given time period or production run. Then, measure each type of defect individually. This provides both an overall value for defects and pinpoints which type is most common.
Production outputs
Production outputs may be measured as the number of parts produced, the number of opportunities for defects to occur, the total production volume or the amount of time spent producing products.
Each measurement offers different insights. For example, measuring defects as a function of time helps identify the average rate at which defects occur, while measuring defect density against opportunities for failure to occur, such as at each stage of the production process, can help pinpoint root causes.
Put simply, the lower your defect density and the higher your first pass yield, the better your overall process control.
How to calculate defect density
The defect density formula is as follows:
Defect density = Number of defects / Size of production output
Here’s an example. Sam’s Spring company finds 10 defects for every 1,000 springs, so:
Defect density = 10 / 1,000 = 0.01
Multiplying this value by 100 converts it to a percentage, resulting in a defect density of 1% for Sam’s Springs.
Consistent measurement is the key to success for effectively applying defect density data across your production line. Consider Sam’s Springs: if the company varies its measurement parameters—such as measuring the first hour of output one day, two hours the next, and four hours the day after—they may overlook key data.
Here’s why. Measurement one shows 20 defects in the first hour. Measurement two shows 25 in two hours and measurement three shows just 30 in four hours.
So, what’s going on? Most defects occur in the first hour of production. This could be due to faulty startup processes or machine issues due to lubrication or pressure that are solved over time. Regular measurement of this first hour helps pinpoint and address these problems, while changing parameters means missed data.
Consistent measurement periods provide reliable trend tracking, which is critical for companies to take targeted action.
Why defect density matters
Defect density has multiple impacts on manufacturing operations, including:
- Cost control — Increased defect density leads to higher production costs due to the need for product rework and the expense of scrapping materials or products that are defective.
- Delivery timelines — Higher defect density means it takes longer to reach production quotas and get products out for delivery.
- Customer satisfaction — Shipping defective parts can damage customer trust, reduce volumes and harm brand reputation.
- Product profitability — The lower your defect density, the higher your yield and the lower your cost per unit, in turn increasing your profitability.
- Process improvement initiatives — Applying defect data at scale can help you meet the goals of process initiatives such as Lean or Six Sigma.
Factors that influence defect density
For most manufacturers, defects don’t have a single cause. Instead, multiple factors may conspire to increase defect density.
Raw material quality, supplier consistency and process security are up first. Higher-quality materials and components that are vetted by trusted suppliers are less likely to cause production failures. Consider food and beverage manufacturing. Higher-quality ingredients are less likely to result in food safety issues. In the case of an auto manufacturer, meanwhile, well-made components from third-party suppliers play a key role in product consistency.
Operator training also plays a role. Highly skilled operators are less likely to make mistakes and can identify potential defect risks before production begins. Standard operating procedures (SOPs), meanwhile, provide clear instructions for any users or operators that help ensure consistent performance and quality.
Additional factors include machine calibration, maintenance and production environments. If machines are incorrectly calibrated, they may produce items that are out of spec. If equipment is not regularly maintained, it may fail during high-volume production runs. If production occurs in environments that are not properly cleaned or maintained, or are regularly above the suggested operating temperature for equipment, defect density may increase over time.
Finally, design complexity may impact defect destiny. More complex processes are naturally prone to defects because there are more opportunities for failure. Consider a solid metal part versus one that’s part of a module containing a hinge. The hinge adds complexity and therefore increases the risk of defects.
Strategies to reduce defect density
While the causes of defects vary across industries and organizations, seven common strategies can help lower defect density.
1. Implement preventive maintenance: Preventive maintenance sees machinery repaired on a regular schedule rather than waiting for breakdowns to occur. This improves reliability and reduces the risk of machine-driven defects.
2. Use statistical process control (SPC): Statistical process control solutions monitor the variability of processes to help identify potential defect points.
3. Adopt automated inspection systems: Automated detection systems run in tandem with manufacturing processes and can be configured to detect conditions that may be tied to defects, such as machines running too hot or experiencing sudden slowdowns.
4. Conduct root cause analysis: Using root cause failure analysis frameworks such as the “5 Whys” or fishbone diagrams helps trace defects back to their source.
5. Provide operator training: Training on new machine software or hardware keeps staff up to date on best practices, while regular refresher training reduces the risk of mistakes tied to familiarity.
6. Engage in supplier quality management programs: Working directly with suppliers to define and track material quality and enhance quality assurance lowers the risk of intrinsic product defects.
7. Weight defects accordingly: As noted above, defects may be critical, major or minor. Critical defects carry the most weight—if you are tracking 1 critical, 5 major and 25 minor defects, solving the critical concern will have the biggest impact on your defect density.
Tracking and benchmarking defect density
Defect density is only effective if companies consistently track and benchmark this KPI.
Tracking must combine both point-in-time results and defect density measurements over time. While it’s worth carrying out spot checks to determine the defect density at different points in the production cycle, or during times of high or low order volumes, it’s also important to collect and track this data over time. By combining short-term measurements with historical defect data, manufacturers can discover defect trends. For example, if week-over-week data shows a slight reduction in defects, but a year-over-year analysis indicates a steady increase, it’s worth taking action.
Organizations can also use defect density to benchmark performance against industry standards, if available. This is because not all industries have the same expectations for defect density. Consider food manufacturing. Low defect density is a top priority for these companies. Failure to meet regulatory expectations could lead to audits, investigations and even business closures. Other companies may have higher acceptable density standards, especially if they can repurpose defective parts.
For example, if your defect density is 2% but the industry standard is 4%, it may make sense to prioritize other metrics such as cycle time or mean time to repair (MTTR). If, however, the industry standard is 1%, it’s critical to drill down and discover root causes.
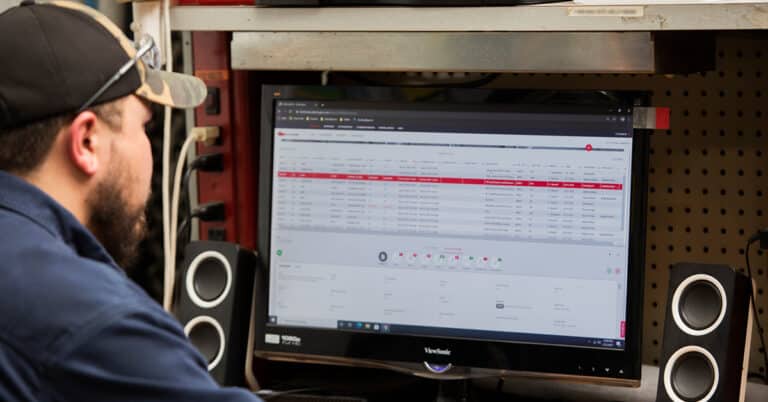
Managing defect density data requires both clearly defined industrial maintenance KPIs and accessible dashboards that display real-time data and provide clear visualizations. This enables data sharing across production teams, floor managers and C-suites to ensure everyone is on the same page.
Lowering your defect density
Defect density is a critical metric tied to cost, operational efficiency and customer satisfaction. As a result, organizations need to set clear defect density goals in the context of a broad quality improvement plan.
While tracking and improving manufacturing KPIs in-house is possible, many companies lack the time or resources to do so effectively. In practice, it’s often more cost-effective to partner with an experienced provider who can deliver customized plans and outsourced expertise.
Key benefits of outsourced providers include:
- Implementing data analytics and root cause analysis to eliminate recurring defects
- Deploying predictive maintenance strategies to reduce equipment-related defects
- Creating continuous improvement initiatives to optimize production processes
- Building long-term strategies to deliver higher yield at lower cost
Decrease your defect density with expert help. See how ATS can improve production quality, increase data visibility and reduce costly defects. Let’s talk.
References
American Society for Quality. (n.d.). Cost of quality. ASQ. Retrieved November 10, 2025, from https://asq.org/quality-resources/cost-of-quality


