


Improvement in manufacturing productivity, efficiency and effectiveness is a goal that’s shared across every manufacturing company. In the course of pursuing improvement, the method by which you measure success is critical to the results you’ll see.
One of the best metrics used to drive improvement in manufacturing is overall equipment effectiveness (OEE), which measures how much of your planned production time is actually productive. OEE is one of the most important KPIs in manufacturing because it connects equipment performance directly to profitability.
Below, we’ll answer the question “What is OEE?” and take an in-depth look at each contributing OEE factor. We’ll also examine some OEE best practices to help improve your results.
What is OEE in manufacturing?
As a broad definition, overall equipment effectiveness is an aggregate statistic for a machine or a group of similar machines. It benchmarks equipment uptime, overall output and quality output. OEE compares actual outputs and results in several areas against standard or expected results, producing an overall number that can be used as a baseline for future improvement. The general formula for OEE is Availability x Performance x Quality, multiplying three percentages to determine the final number.
OEE in manufacturing is one of the most consistent, reliable and actionable ways to measure productivity. OEE is measured as a percentage and indicates the proportion of operating time that is spent producing usable parts, in other words, time that is productive or effective in meeting operational goals.
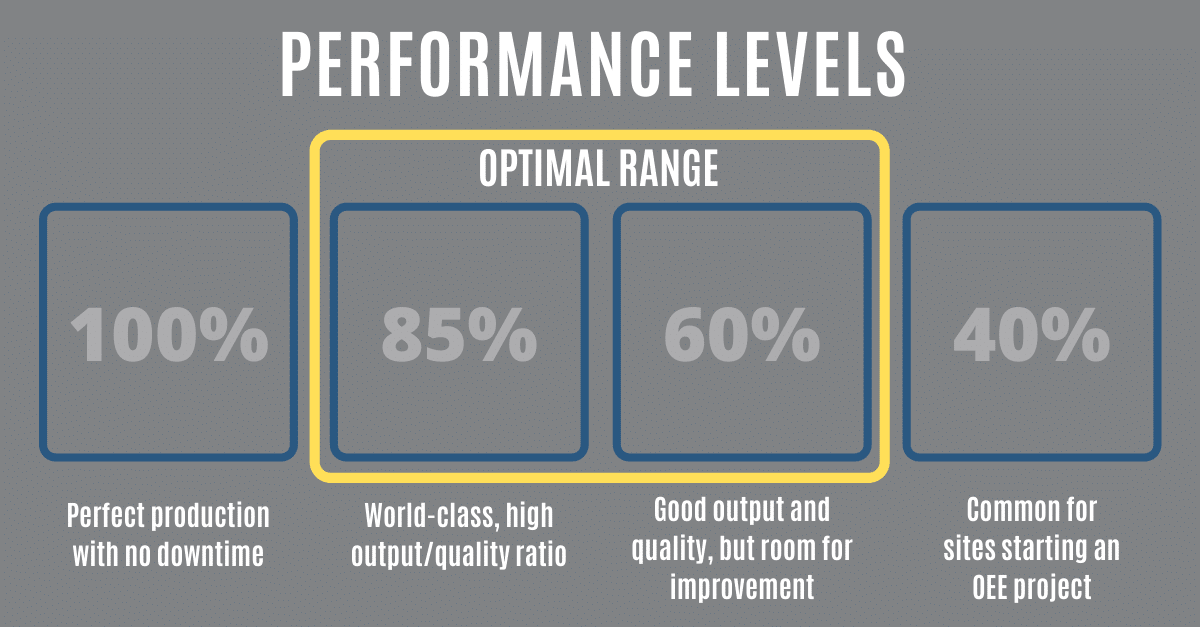
What is a good OEE score?
- 100% = perfect production
- 85% = world-class
- 60–85% = typical
- <60% = significant improvement opportunity
If your overall equipment effectiveness formula results in 100%, that means that your equipment is producing 100% of parts to spec—at full capacity with zero unplanned downtime. This is the goal to which manufacturers should aspire, especially when implementing OEE maintenance strategies.
If your OEE score is 85%, this means you have a highly efficient, world-class organization with proactive operations that minimize downtime. Most organizations top out around this level.
If your score is 60% to 85%, you’re in the typical range. There are areas for operational improvements and enhancements.
If your OEE score is less than 60%, there is significant room for improvement, such as reviewing processes and implementing efficiencies.
If you’re wondering how to measure OEE data points, they can be calculated using the following methods:
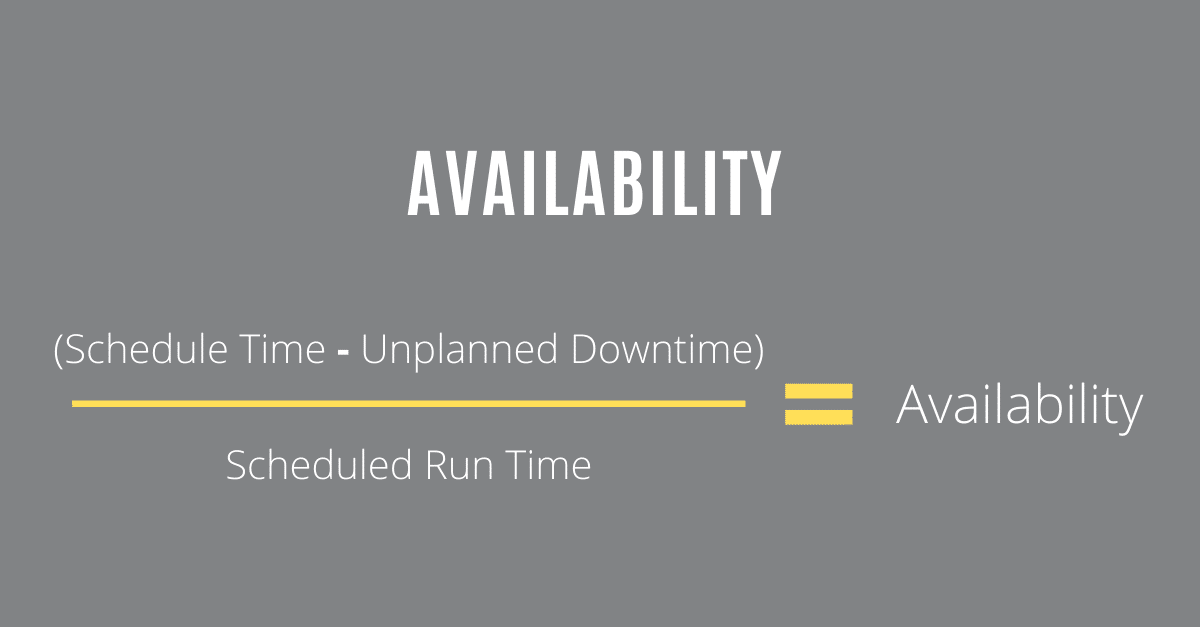
Availability
The Availability metric compares actual machine production time with standard or expected uptime. This measurement factors in unexpected downtime and other production losses—such as setup and adjustment time. However, it does not factor in planned or scheduled downtime (scheduled maintenance and lunch breaks). Availability is calculated as Actual Available Time (scheduled time minus unplanned downtime) divided by Scheduled Run Time, resulting in a percentage.
Some common availability losses are equipment failures, changeovers, waiting for materials, and maintenance delays. Availability is often the biggest opportunity area for improvement in most facilities.
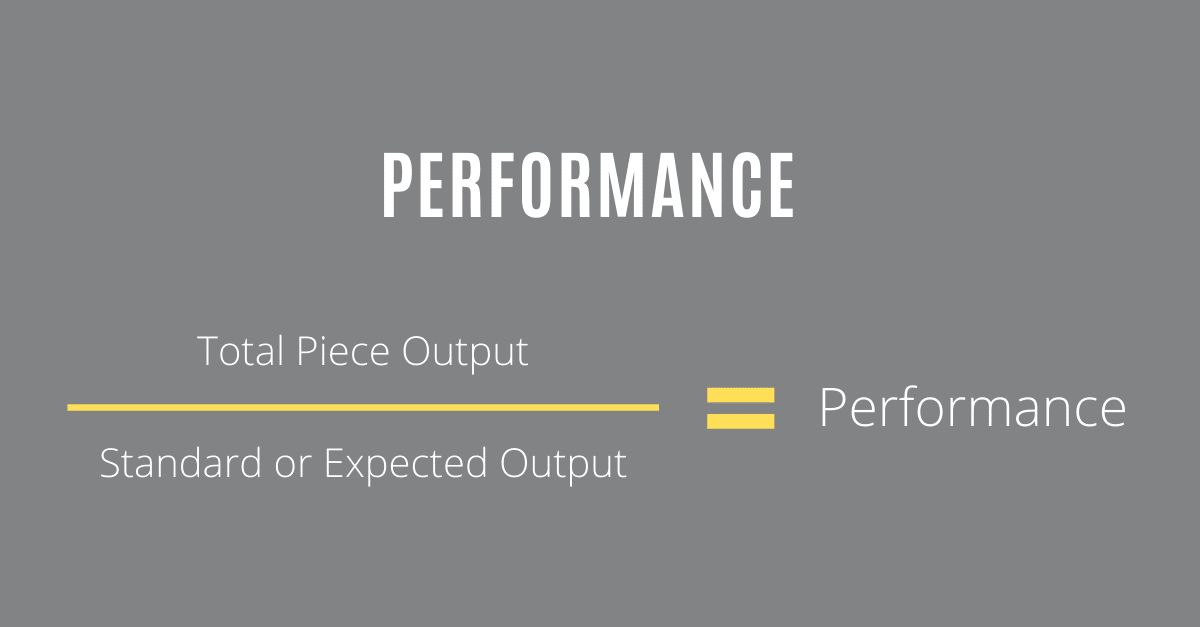
Performance
The performance consists of the total output of equipment in a given time period (such as a shift) as related to the expected output. This metric is a raw number that includes all units produced, whether or not they are accepted or rejected. The performance metric is calculated as Total Piece Output divided by Standard or Expected Output. Standard output can be provided by OEM documentation or may be arrived at by calculating your output averages over a long period.
Some common performance losses are slow cycles, micro stoppages, and operator inefficiencies. Even small slowdowns can significantly reduce OEE over time.
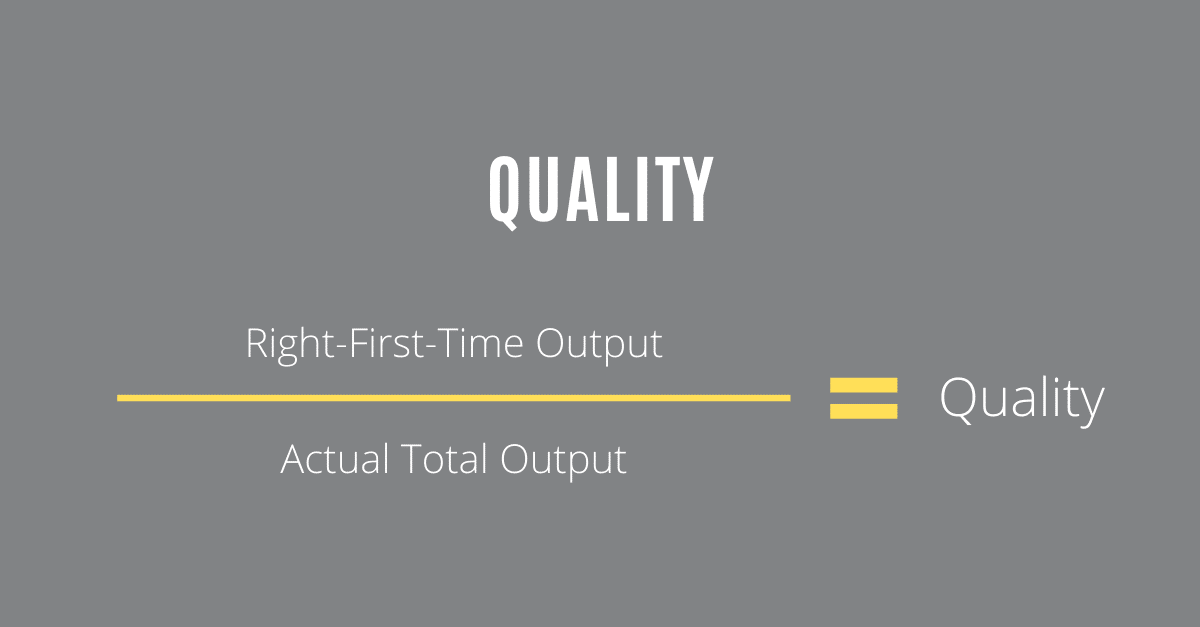
Quality
Quality measures the “right first-time” output of equipment, providing insight into lost time due to repairs, rejections and secondary processes. Quality is calculated as Right-First-Time Output divided by Actual Total Output.
Some common quality losses are defects, rework and scrap. Quality losses can hit profitability directly through wasted materials and labor.
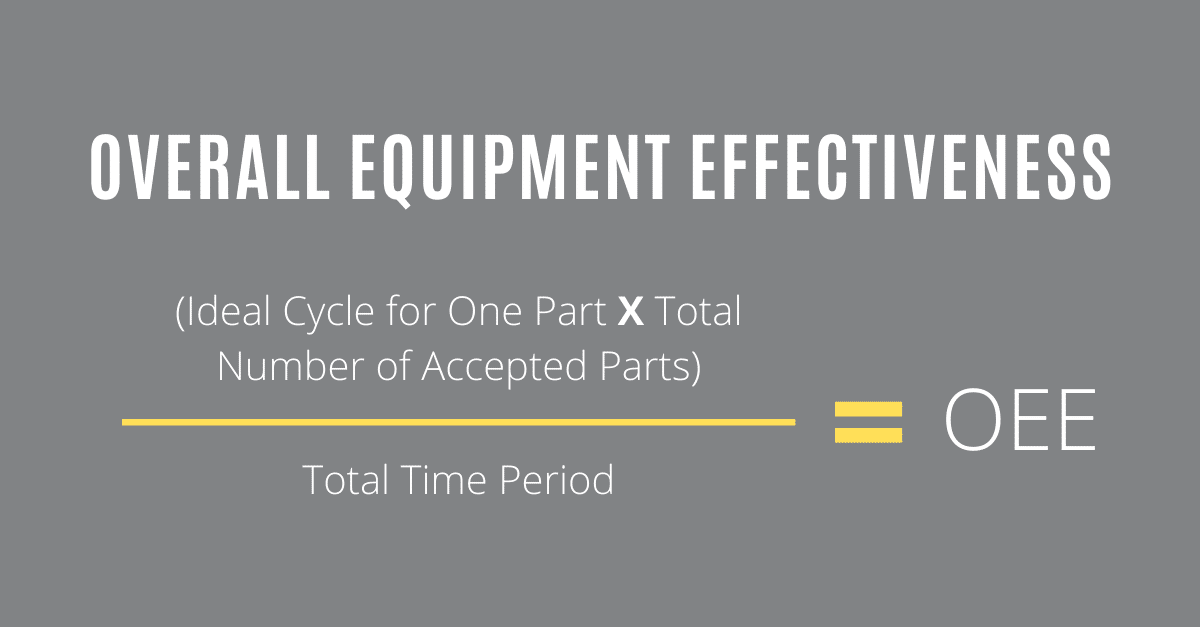
Once you have calculated each of these percentages, multiply them to arrive at your OEE. It is also possible to arrive at a quick, rough OEE calculation with the following equation: Ideal cycle time for one part, multiplied by the total number of accepted parts in a given time period. Take the product of this multiplication and divide that number by the total time period in question (ensuring that units of measure are consistent in all aspects of the equation).
The six big losses that impact OEE
Poor OEE is driven by the Six Big Losses, a framework that breaks productivity loss into three categories:
- Availability losses such as equipment breakdowns, setups and adjustments.
- Performance losses such as minor stops and reduced speed.
- Quality losses such as startup defects and production defects.
Manufacturers can identify and resolve these inefficiencies by using OEE tracking, such as OEE software with real-time monitoring tools to track downtime, tracking OEE metrics, conducting finding studies to locate the root cause of problems and speaking with employees on the line to identify inefficiencies. What works best for you will depend on your organization.
OEE calculation example
Here is a step-by-step sample calculation:
- Planned Production Time = 480 minutes
- Downtime = 60 minutes → Availability = 87.5%
- Actual Output = 400 units
- Ideal Output = 500 units → Performance = 80%
- Good Units = 380 → Quality = 95%
OEE = 0.875 × 0.80 × 0.95 = 66.5%
In this example, the total score is 66.5%, which is typical. In real-world scenarios, OEE rarely reaches 100% due to the Six Big Losses. Realistic OEE scores are generally in the 60% to 80% range. World-class manufacturing organizations that employ continuous process improvement methodologies and lean manufacturing may reach 80% or higher.
OEE best practices
It is important to note that by itself, OEE does not have much significance. Benchmarking OEE against other facilities, or even other machines or processes in your facility, will not yield actionable insights. When you calculate OEE for multiple machines, the data is best used as a benchmark for future production efficiency improvements, always comparing “like to like”—that is, similar machines and processes to each other. Several best practices for OEE in maintenance can help to maintain and improve your OEE. These include:
- Reducing downtime: Proper preventive and predictive maintenance can reduce unplanned downtime, improving the Availability statistics and increasing overall OEE.
- Skilled workers: Workers with deep expertise in specific maintenance processes can improve machine uptime and increase quality rates by drawing upon their knowledge to quickly maintain equipment for optimal results. Reduced setup time will increase the Availability metric, and improved throughput may increase Performance and Quality measurements.
- Data and technology: Connected machinery, sensors, computer maintenance management systems (CMMS) and other state-of-the-art technology can provide the most accurate insights into your actual output, and over time can provide a detailed and accurate snapshot of performance expectations. With these numbers in hand, you can be assured that your OEE calculation is as accurate, consistent and effective as possible.
OEE improvement is not about one change; it requires continuous improvement optimization across people, processes and technology.
How to improve OEE in manufacturing
There are a number of ways that manufacturers can improve effectiveness metrics. These include:
- Determine critical assets: Identify and focus on the equipment and components that are the major drivers of the measures of OEE, especially those that contribute to machinery uptime, measured as Availability.
- Upgrade IIoT capabilities that focus on real-time data collection and automation: Data collection and monitoring are among the most effective ways to reduce or eliminate unplanned downtime, and industrial sensors are the most cost-effective way to implement these strategies. Machine health monitoring plans such as Reliability 360® from ATS are a proven way to gain the benefits of this technology, along with the right knowledge to effectively use the data.
- Assign a technician as an overseer of OEE implementation and monitoring: While OEE should be a top-down strategy that every technician and operator should be aware of, it is also critical to ensure that there are dedicated personnel focusing strictly on OEE monitoring because this way of operating often requires new methods of working and measuring.
- Utilize data visualization to display real-time OEE to employees: OEE is an ongoing measure, and every minute of downtime and every rejected part will detract from the OEE rating. By displaying real-time performance metrics, employees will remain focused on the goal at hand increasing OEE with an eye toward 100%.
- Focus on enhanced employee engagement and communication, which leads to higher productivity and fewer accidents/defects: By creating a sense of buy-in and ownership over OEE and other performance metrics, employees will be more engaged and focused on their tasks and less likely to make mistakes that can pose safety risks, while also reducing OEE.
- Schedule regular reviews of daily operations across departments in the production process: OEE should not be an annual or a quarterly check-in—it is critical to keep tabs on operations as frequently as possible, which is facilitated by the data collected via industrial sensors. Reviewing operations at least daily ensures that focus remains where it should.
Even a 5% improvement in OEE can result in significant gains in production output without additional capital investment.
The role of maintenance in improving OEE
Maintenance has a direct effect on OEE. Over time proper maintenance will improve equipment availability—meaning fewer breakdowns, fewer performance losses and stronger equipment performance. Well maintained equipment is more likely to deliver better cycle times, optimized equipment speed and output. That can support better overall quality and fewer defects and less stop time.
To achieve greater OEE, it is recommended that organizations practice regular predictive maintenance of equipment, which will help avoid unplanned downtime and availability losses. Developing a program that seeks to improve machine reliability through regular maintenance and condition monitoring of equipment will help increase the overall efficiency of an organization.
OEE improvement with ATS
As a factory maintenance solution service provider with over three decades of equipment maintenance experience, ATS workforce, industrial maintenance and MRO solutions are geared to help you a baseline and improve OEE. Our goal is to address skills gaps in your organization, boost uptime and quality output, and assist with technology consulting and implementation to bring your existing equipment into the modern manufacturing landscape, ensuring you have the most accurate production and effectiveness measurement possible. For more information about how we can help you with OEE improvement, contact us today.