





Equipment failures are time-consuming and costly. Consider that downtime costs manufacturers between 5% and 20% of their productive capacity, meaning they lose at least that much potential revenue until machines are back up and running. Even more worrisome is that 80% of facilities are unable to accurately predict total downtime, meaning they’re forced to react after failures happen rather than staying ahead of the problem.
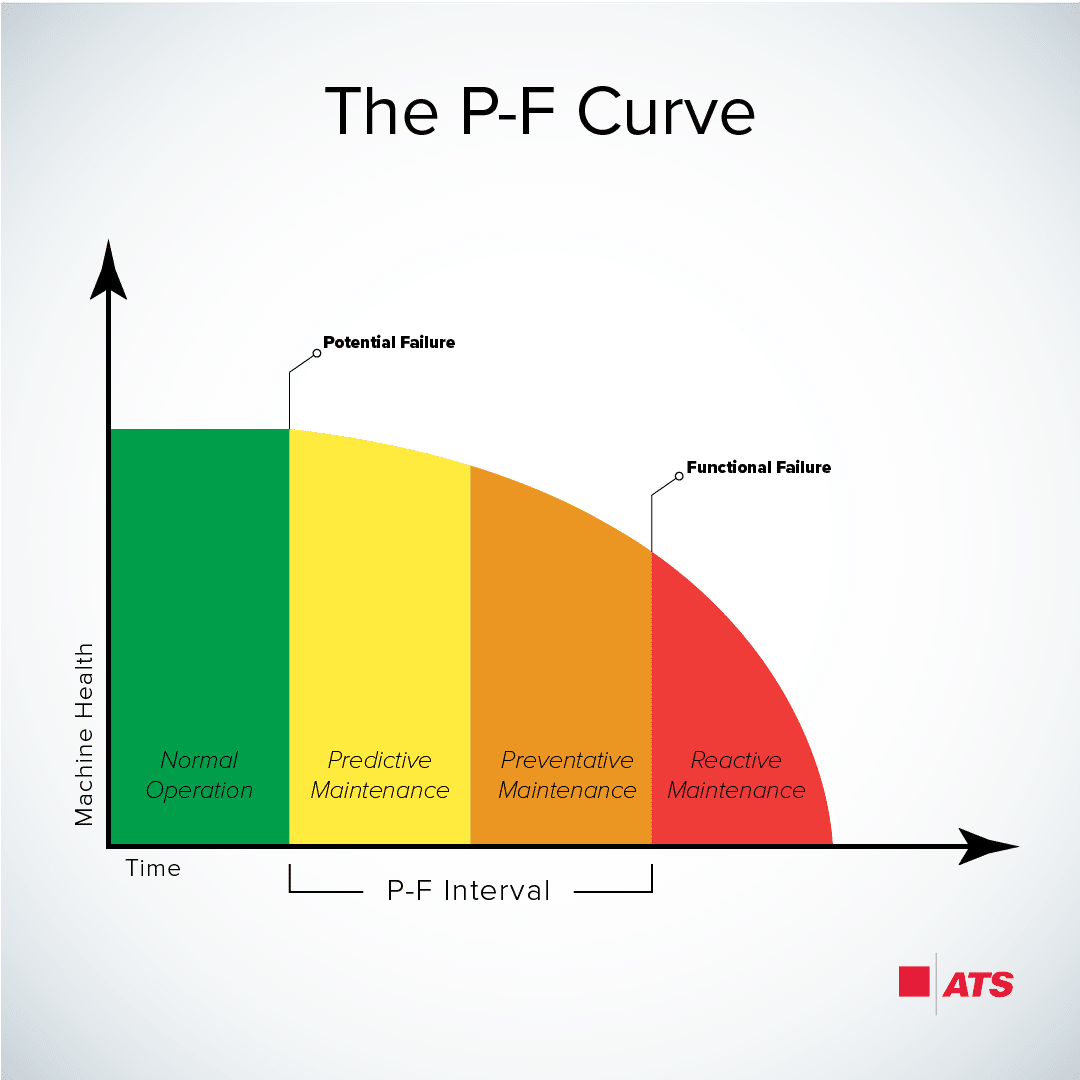
Understanding failure intervals, represented by what’s known as the P-F curve, can help companies better predict maintenance needs and adopt a proactive rather than reactive strategy. This curve shows the relationship between time and the health condition of equipment. “P” is the point of potential failure, while “F” is the point of functional failure.
Graphing this curve can help manufacturers better predict failures and identify optimal timelines for maintenance.
What is a P to F curve?
A P-F curve shows the relationship between machine health and time. Drawing the curve requires a graph with machine health as the “Y” axis and time as the “X” axis. Time increases from left to right, while machine health decreases from top to bottom. There are two key points on the curve: The P point and the F point. Connecting them creates the P to F curve.
- The P point: The P point is the first sign of potential failure. Common signs may include consistently elevated temperature, pressure, or noise. While machines continue to operate normally, the P point is the point at which changes in operation are noticeable.
- The F point: The F point is when machinery fails. It is no longer operational and must be taken offline. Consistent machinery monitoring is critical to ensure the F point is detected as close to its origin as possible. For example, if machinery fails on a Friday evening, but the failure is not discovered until Monday morning, the actual F point is much earlier than recorded—critical information for companies that want to limit failure.
- The P to F curve: The P to F curve is found by connecting point P and point F with a curved line. The line initially appears nearly horizontal, with perhaps a very gradual decline, but begins to drop more once it reaches the P point. Once it connects with the F point, the descent becomes significantly steeper, potentially approaching a near-vertical drop.
Understanding the P-F interval
The P to F interval is the time between potential failure and functional failure. For example, if your maintenance teams detect increased machine noise after six months of 24/7 use, and failure occurs two months later, the P to F interval is two months long. The entire curve is eight months long, but the interval only begins after the first sign of possible failure. Put simply, the P to F interval is a window of opportunity to detect and correct potential problems.
While every asset has its own unique failure characteristics, one principle remains consistent: the earlier maintenance teams identify a potential failure, the more repair options they typically have available. During the early stages of the P to F interval, technicians may only need to perform minor adjustments such as lubrication, alignment, balancing, or replacing a relatively inexpensive component. As the interval progresses and equipment degradation accelerates, repairs often become more complex, requiring longer shutdowns, additional labor and more costly replacement parts.
Not every piece of equipment warrants the same level of monitoring. Critical assets that directly affect production throughput, worker safety or product quality should receive greater attention than equipment with minimal operational impact. Conducting a criticality assessment helps maintenance teams prioritize inspection resources, set monitoring frequencies and establish realistic P to F intervals for different asset classes. That way inspection hours go to the assets that stop the line, rather than spreading the same route coverage across everything in the plant.
The length of the interval varies based on factors such as the type of machinery used, its runtime schedule, and its failure mode.
Ideally, machine inspections should happen within this interval. Reliability-centered maintenance (RCM) guidance sets inspection intervals shorter than the P to F interval so that some rounds will occur before P and still gather baseline data. Wasted effort is avoided by matching inspection frequency to the shortest credible P to F interval. If inspections happen after F, the machine has already failed, meaning they reveal no useful data.
Using P to F curves in preventive maintenance planning
By mapping P to F curves and identifying P to F intervals, businesses can improve maintenance planning. Consider a piece of machinery that typically reaches its P point after eight months. By scheduling proactive maintenance for month 6 or 7, companies can repair or remove affected parts and increase the time until the P point occurs.
If P to F intervals are not considered, organizations may waste money scheduling maintenance early and replacing parts that are still in good condition. This may also push machines to the point of failure, forcing them to spend time and money carrying out reactive maintenance or replacing equipment entirely.
Successful preventive maintenance programs also recognize that P to F intervals are not static. As equipment ages, operating conditions change, production demands increase, or maintenance practices improve, failure intervals may lengthen or shorten. Reviewing maintenance history on a regular basis allows reliability teams to refine inspection frequencies and maintenance schedules based on actual equipment performance instead of relying solely on manufacturer recommendations. Over time, these adjustments can support more efficient maintenance strategies, with less unnecessary work and fewer failures that arrive without warning.
Cross-functional communication matters just as much when using P to F curves. Maintenance personnel, operators, production supervisors, and reliability engineers all observe equipment from different perspectives. Operators often notice subtle changes in machine behavior before sensors generate alarms, while maintenance technicians can correlate these observations with inspection findings and historical repair records. Sharing what each group sees gives the reliability team a fuller picture of equipment health and makes it easier to defend a call to pull an asset early.
How to detect the P point (potential failure) early
Sensors and analytics help improve the accuracy of P point detection. For example, the use of vibration sensors can detect changes in vibration intensity or frequency, which may then trigger a proactive maintenance event.
Data analytics, meanwhile, helps separate relevant and non-relevant events. Consider a high-temperature machine completing a large volume of orders. While it may show increased temperature, this may be tied to current order volumes rather than P to F curves. Analytics that use both current and past data can help separate P points from normal operational fluctuations.
Common tools in early failure detection
Some common tools in early failure detection using condition-based monitoring include:
- Vibration analysis
- Infrared thermography testing
- Sensor data
- Temperature monitoring
- Visual inspections
Although each condition monitoring technology serves a different purpose, they are often most effective when used together. For example, vibration analysis may identify an emerging bearing issue, while infrared thermography confirms localized heat generation, and oil analysis reveals increased metal particles caused by wear. Reading those methods against each other can help maintenance teams rule out false positives and judge both the severity of the issue and the most appropriate corrective action before functional failure occurs.
The frequency of condition monitoring should also reflect equipment criticality and expected failure modes. Highly critical production assets may justify continuous online monitoring through permanently installed sensors, while less critical equipment may only require periodic inspections during scheduled maintenance rounds. Matching the method to the asset keeps continuous monitoring spend on the equipment that stops production, without leaving the rest of the plant uninspected.
The role of technology and training in failure prevention
Technology plays a critical role in defining and applying P to F curves. For example, IoT-connected sensors provide real-time data about machine operations. Computerized maintenance management systems (CMMS), meanwhile, help track failure curves and schedule necessary maintenance. Finally, the use of AI-based alerts is useful in flagging issues that require immediate maintenance.
It’s also important to give staff the training and tools they need to identify baseline operations, recognize changes in machine behavior, and pinpoint outliers that are not indicative of failure.
Establishing standardized inspection procedures further strengthens P to F curve implementation. When technicians follow consistent routes, use the same measurement techniques and document findings using standardized criteria, organizations build more reliable historical data. This consistency makes it easier to identify long-term trends, compare equipment performance across facilities and improve predictive maintenance models over time.
Organizations should also encourage continuous learning by reviewing equipment failures after they occur. Performing root cause analysis following significant breakdowns helps determine whether warning signs were missed, inspection intervals were too long or maintenance activities were delayed. Feeding those findings back into the inspection schedule is how teams get better at catching failures earlier in the P to F interval instead of repeating the same breakdown next quarter.
Benefits of implementing P-F curve thinking
Using the P to F curve to inform maintenance practices offers several benefits for manufacturers, including:
- Reduced unplanned downtime: By creating maintenance schedules that proactively replace and repair parts just before average machine P points and follow-up with inspections after P points occur, businesses can reduce the risk of unplanned machine downtime.
- Lowered maintenance costs: Minimizing emergency repairs and full machine replacements can significantly lower maintenance costs.
- Extended asset life: Addressing potential failures before they occur extends equipment life and reduces the need for full replacement.
- Enhanced safety: Sudden machinery failures can cause serious injuries. P to F-based maintenance enhances safety by making issues more predictable, thereby limiting their potential impact.
- Improved decision-making: Equipped with data about machine performance, companies can create more accurate capital spending and parts purchasing strategies.
Beyond reducing maintenance expenses, organizations that embrace P to F curve thinking often experience broader operational improvements. Production schedules become more predictable because fewer unexpected breakdowns interrupt manufacturing. Spare parts inventories can be managed more effectively since replacement components are ordered based on anticipated maintenance activities rather than emergency situations. Maintenance teams also spend less time responding to urgent repairs and more time performing planned work that delivers greater long-term value to the organization.
These improvements support higher overall equipment effectiveness (OEE), better asset utilization and more consistent product quality. As organizations continue collecting equipment performance data, they can further refine maintenance intervals, improve forecasting accuracy, and make more informed capital investment decisions regarding equipment replacement or upgrades. Used together, condition monitoring, preventive maintenance and P to F curve analysis give reliability teams a record of what actually failed and when, which is what makes the next set of intervals more accurate than the last.
How preventive maintenance applies P to F curve insights
The goal of preventive maintenance is to stay ahead of failures rather than reacting after they occur. Here are five best practices to help make the most of P to F curve insights for maintenance:
- Deploy condition monitoring and data collection tools: Real-time condition monitoring and data collection tools help track failure curves and build targeted maintenance strategies.
- Leverage predictive maintenance expertise to identify P points: Partnering with predictive maintenance experts is a great way to jump-start P to F curve detection and discover where maintenance processes need to improve.
- Develop customized maintenance schedules based on real-time data: By leveraging data collected from CMMS tools, businesses can create proactive maintenance schedules that replace or repair common P point parts just before the P to F interval begins, followed by inspections to ensure the effectiveness of the maintenance.
- Bring in skilled technician teams trained to act within the P to F window: For companies with large production lines, it is often worth bringing in skilled in-house or third-party technician teams to inspect critical machinery during P to F windows.
- Integrate P to F curve methodology into broader maintenance programs: By identifying and applying the P to F curve to maintenance, businesses can better align spending and staffing with evolving equipment needs.
Bottom line? P to F curves combined with preventive maintenance help reduce downtime, improve performance, and lower total costs.
Improve your P to F interval detection and response with solutions from ATS. Let’s talk.
References
Crumrine, Dave and Doug Post. How much is plant or facility downtime costing you? ISA Interchange, International Society of Automation, https://blog.isa.org/downtime-factory-plant-industrial-costs-risks.